Legend : METHODS – Nucleolar Structure
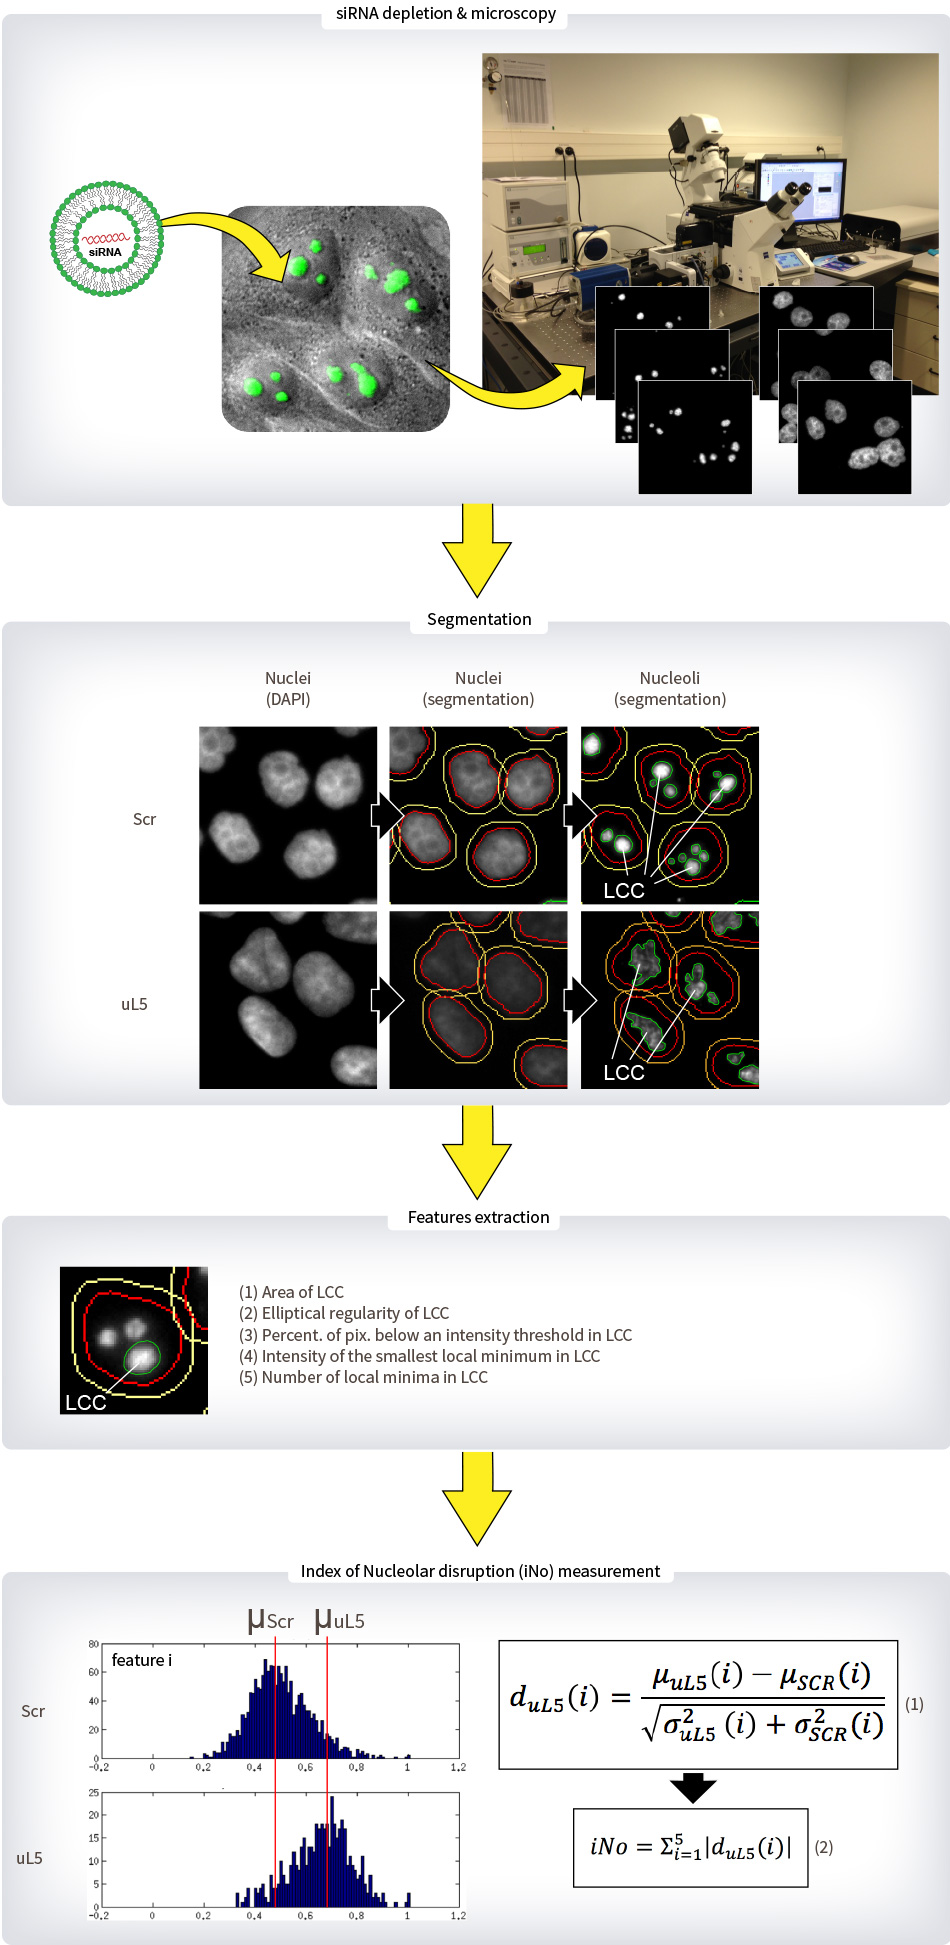
Human cells stably expressing a GFP-Fibrillarin fusion were transfected with three distinct siRNAs specific to each of the eighty r-proteins in 96-well plates and incubated for 3 days. After this incubation time, cells were fixed with formaldehyde and counter-stained with DAPI. The two fluorescent signals (GFP and DAPI) were captured automatically using a Zeiss Axio Observer.Z1 microscope driven by Metamorph with a 20x objective, a LED illumination and a CoolSnap HQ2 camera.
Nucleolar morphology was analysed quantitatively using a homemade image-processing algorithm written in Matlab. Briefly, DAPI and GFP signals were first subjected to classical segmentation where each nucleolus is called a connected component (here depicted for Scr and uL5). Afterwards, five distinct features are quantified for the largest connect component (LCC) of each nucleus of the field of view. Each population of siRNA-treated cells is thus characterized by five d values, each value measuring, for one feature i, the distance between the siRNA-treated and SCR-treated cells feature distributions (equation 1). An index of nucleolar disruption (iNo) that characterizes the degree of nucleolar disruption was finally defined as being the absolute sum of the d values for each feature (equation 2).