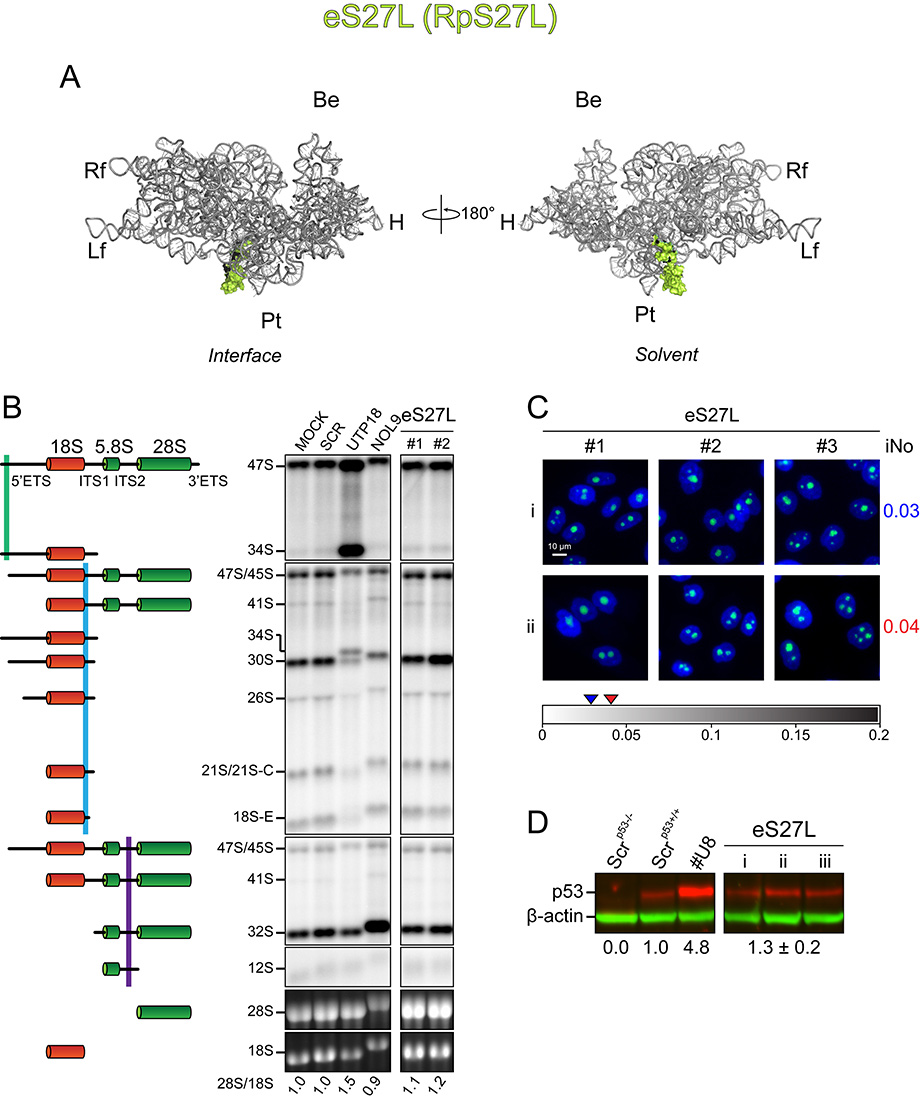


A, 3-D models of human ribosomal subunits based on PDB entries 3J3D and 3J3A (for SSU r-proteins), and on 3J3F and 3J3B (for LSU r-proteins) highlighting the position of individual r-proteins on mature subunits. On small subunits, the 18S rRNA is shown in grey; on large subunits, the 5S, 5.8S and 28S rRNAs are shown in red, blue and grey, respectively. Morphological features of the subunits are highlighted. On the LSU: the L1-stalk, the central protuberance (CP) and the phospho-stalk (P-stalk). On the SSU, the beak (Be), head (H), platform (Pt), body (Bd), left foot (Lf) and right foot (Rf).
B, Effect of r-protein depletions on pre-rRNA processing and mature rRNA accumulation: northern blots and ethidium bromide-stained denaturing agarose gels showing all RNA intermediates and mature rRNAs detected. The 28S/18S rRNA ratio was calculated from electropherograms. A calibration set (MOCK, SCR, UTP18 and NOL9) is included for reference. Schematics representing the RNAs detected are shown to the left.
C, Effect of r-protein depletions on nucleolar structure: representative microscopic images (blue signal, DAPI; green, fibrillarin) captured with each of the three distinct siRNAs (#1, #2, and #3) used in duplicated screens (i, and ii). iNo values for each screen indicated to the right, and on a scaled bar at the bottom.
D, Effect of r-proteins depletions on p53 steady-state accumulation: fluorescent quantitative western blotting was performed in triplicate (i, ii, iii). The p53 signal was corrected for loading, using β-actin detection as a reference, and normalized to the signal obtained in cells treated with a non-targeting (Scr) control (lane 2). The p53 signal was expressed as a mean of three independent experiments with SD. p53 accumulation upon the depletion of snoRNA U8 is included as a control.